Aim:
This experiment aims to verify Bernoulli’s equation, which relates the pressure, velocity and height of an ideal fluid flowing through a horizontal pipe of varying cross-sectional area.
Theory:
Bernoulli’s Equation states that the total energy of an ideal fluid flowing through a pipe is constant along a streamline. Mathematically, the equation is expressed as
P + 1/2 ρv^2 + ρgh = constant,
Where P is the pressure of the fluid, p is its density, v is the velocity of the fluid, g is the acceleration due to gravity, h is the height of the fluid above a reference point and the constant remains the same along any streamline.
Apparatus and materials required:
We required the following set of apparatus and materials for the verification of Bernoulli’s Equation.
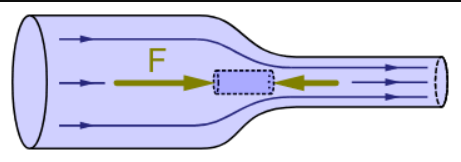
- A horizontal pipe with varying cross-sectional area
- A fluid (water or any other liquid)
- A pump creates a steady flow of fluid through the pipe
- Pressure gauges measure the pressure at different points along the pipeline.
- A flowmeter to measure the flow rate of the fluid
- A manometer to measure the difference in pressure between two points along the pipeline.
- A ruler or measurement tape to measure the height of the fluid above a reference point.
Procedure:
- Set up the apparatus such that the horizontal pipe has a varying cross-sectional area, with the smallest cross-sectional area at the narrowest point.
- Now, fill the pipe with fluid and start the pump to create a steady flow of fluid through the pipe.
- Measure the pressure at different points along the pipe using the pressure gauges. Record the data in a table.
- Measure the flow rate of the fluid using the flowmeter. Record your observations and data in a table.
- Measure the height of the fluid above a reference point using a ruler or measuring tape. Record your data in a table.
- Calculate the velocity of the fluid using the formula v = Q/A, where Q is the flow rate and A is the cross-sectional area of the pipe at a particular point.
- Calculate the difference in pressure between two points along the pipe using the manometer.
- Substitute the values of P, p, v, g and h into Bernoulli’s Equation and calculate the constant.
- Compare the calculated constant with the measured values. If you find that they are within the experimental error, Bernoulli’s Equation is verified.
Data analysis:
The data obtained from the experiment should be analyzed using statistical tools like mean, standard deviation and error bars. A graph of pressure versus distance along the pipe should be plotted to visualize,
the trend of pressure variation. The data should also be compared with the theoretical values obtained from Bernoulli’s equation.
Discussion:
The discussion section of the report should focus on the significance of the results obtained from the experiment. The report should discuss the accuracy of the experiment,
limitations of the apparatus and sources of error. The report should also discuss the implications of the results for the practical application of Bernoulli’s Equation.
Result:
The result of the experiment should include the measured values of pressure, flow rate and height as well as the calculated values of velocity and the constant in Bernoulli’s Equation. The result should also indicate whether Bernoulli’s Equation was verified or not.
Precautions:
- Care should be taken to ensure that the flow of the fluid is steady throughout the experiment.
- The pressure gauges and manometer should be calibrated before use.
- The apparatus should be properly cleaned and dried after use to avoid contamination of the fluid.
- Care should be taken to avoid spillage of the fluid during the experiment.

